library("corrkit")
d <- simulate_cor_data(150)
res <- cor_compute(d, x = c("CRP", "IL6", "NfL", "BIN_CRP"), y = c("depression", "fatigue"),
covariates = "age", labels = attr(d, "labels"))
plot(res)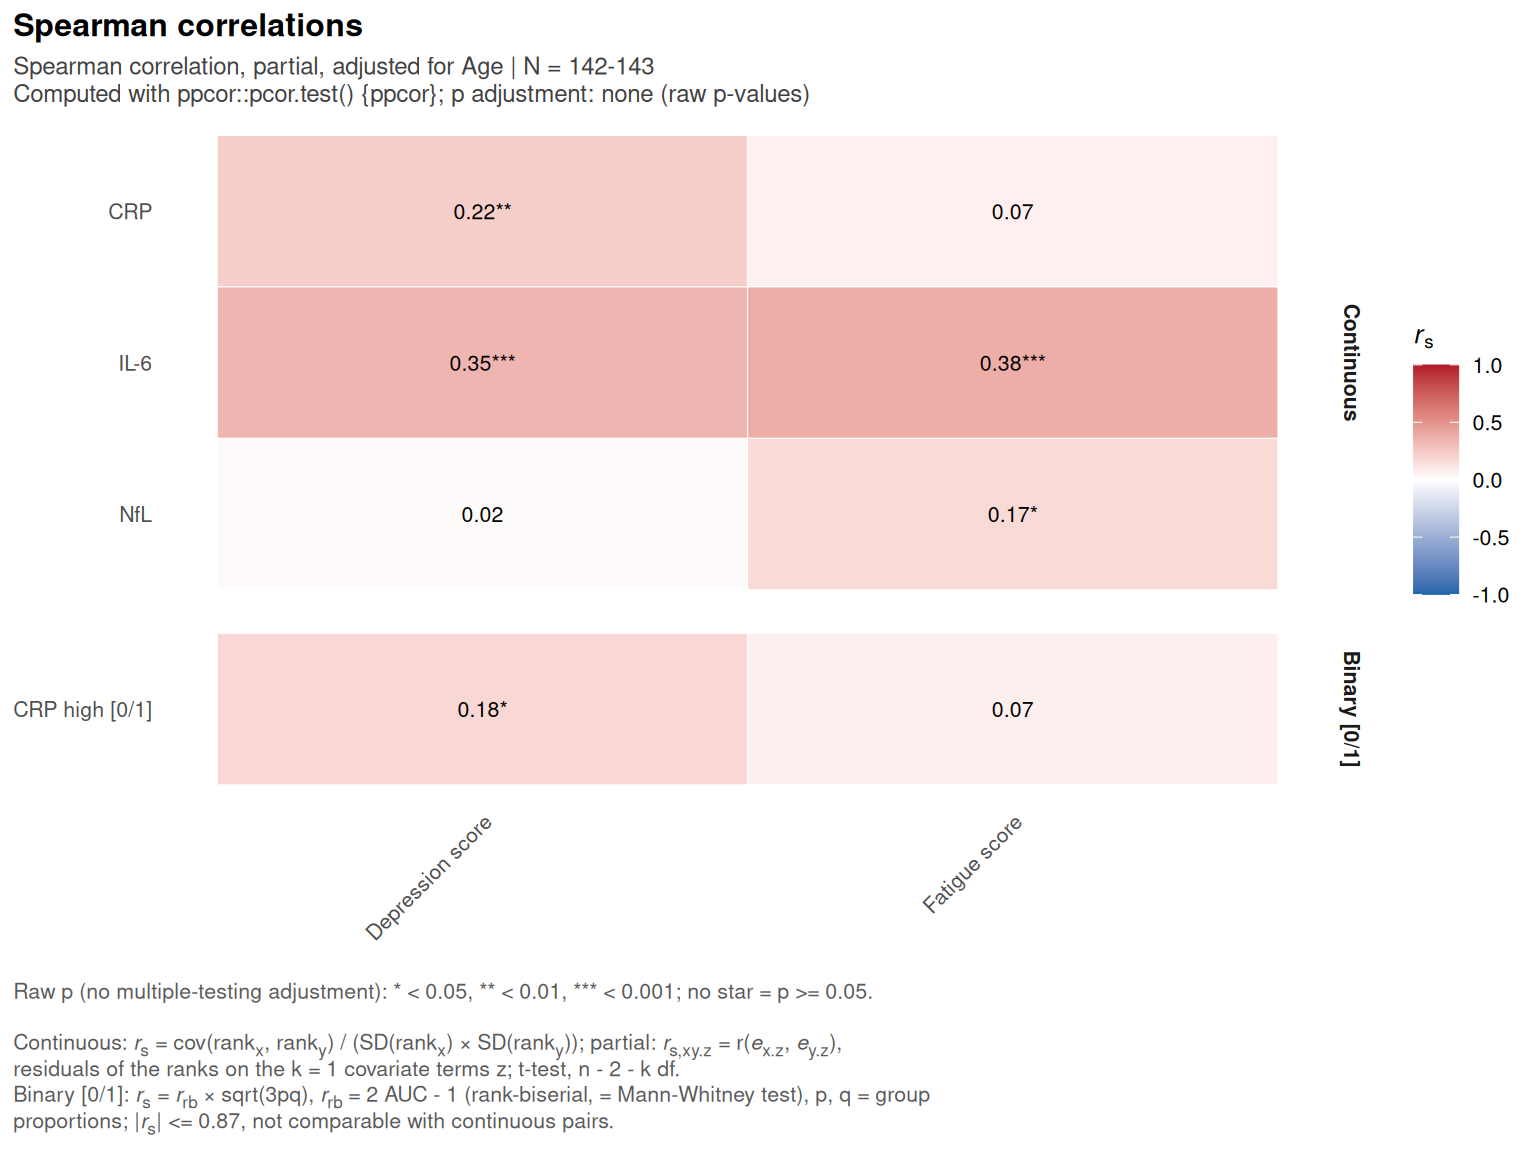
plot(res, type = "forest")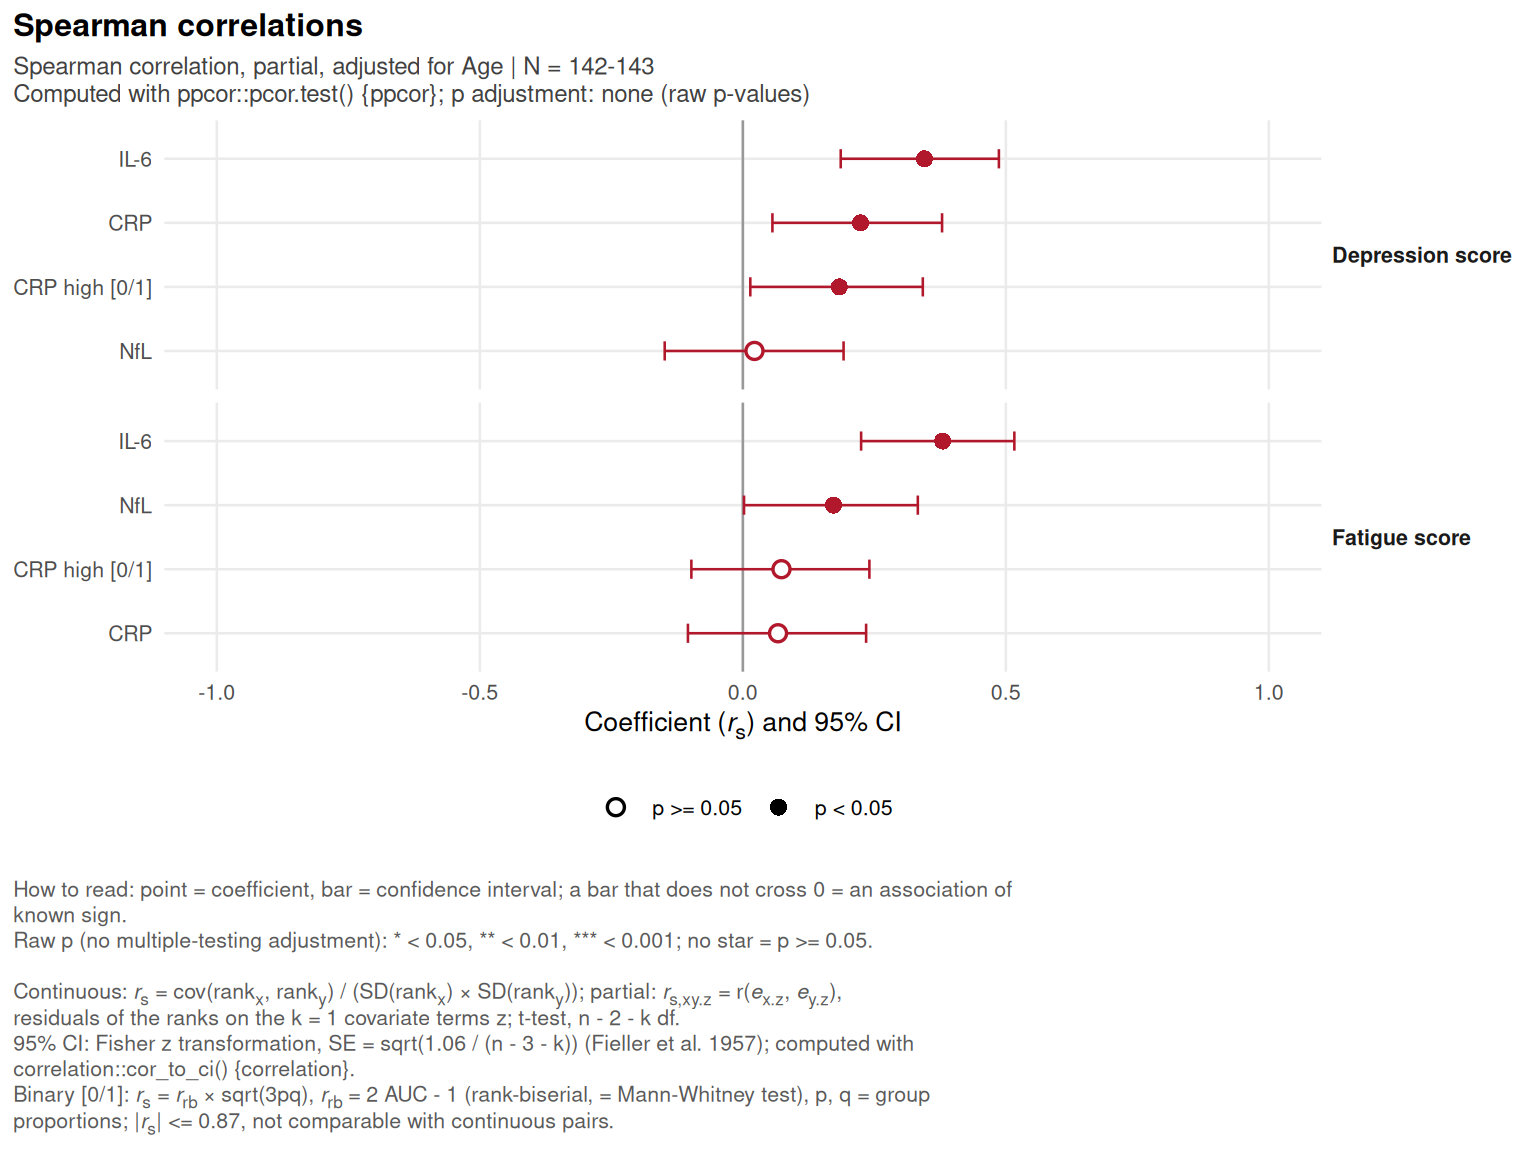
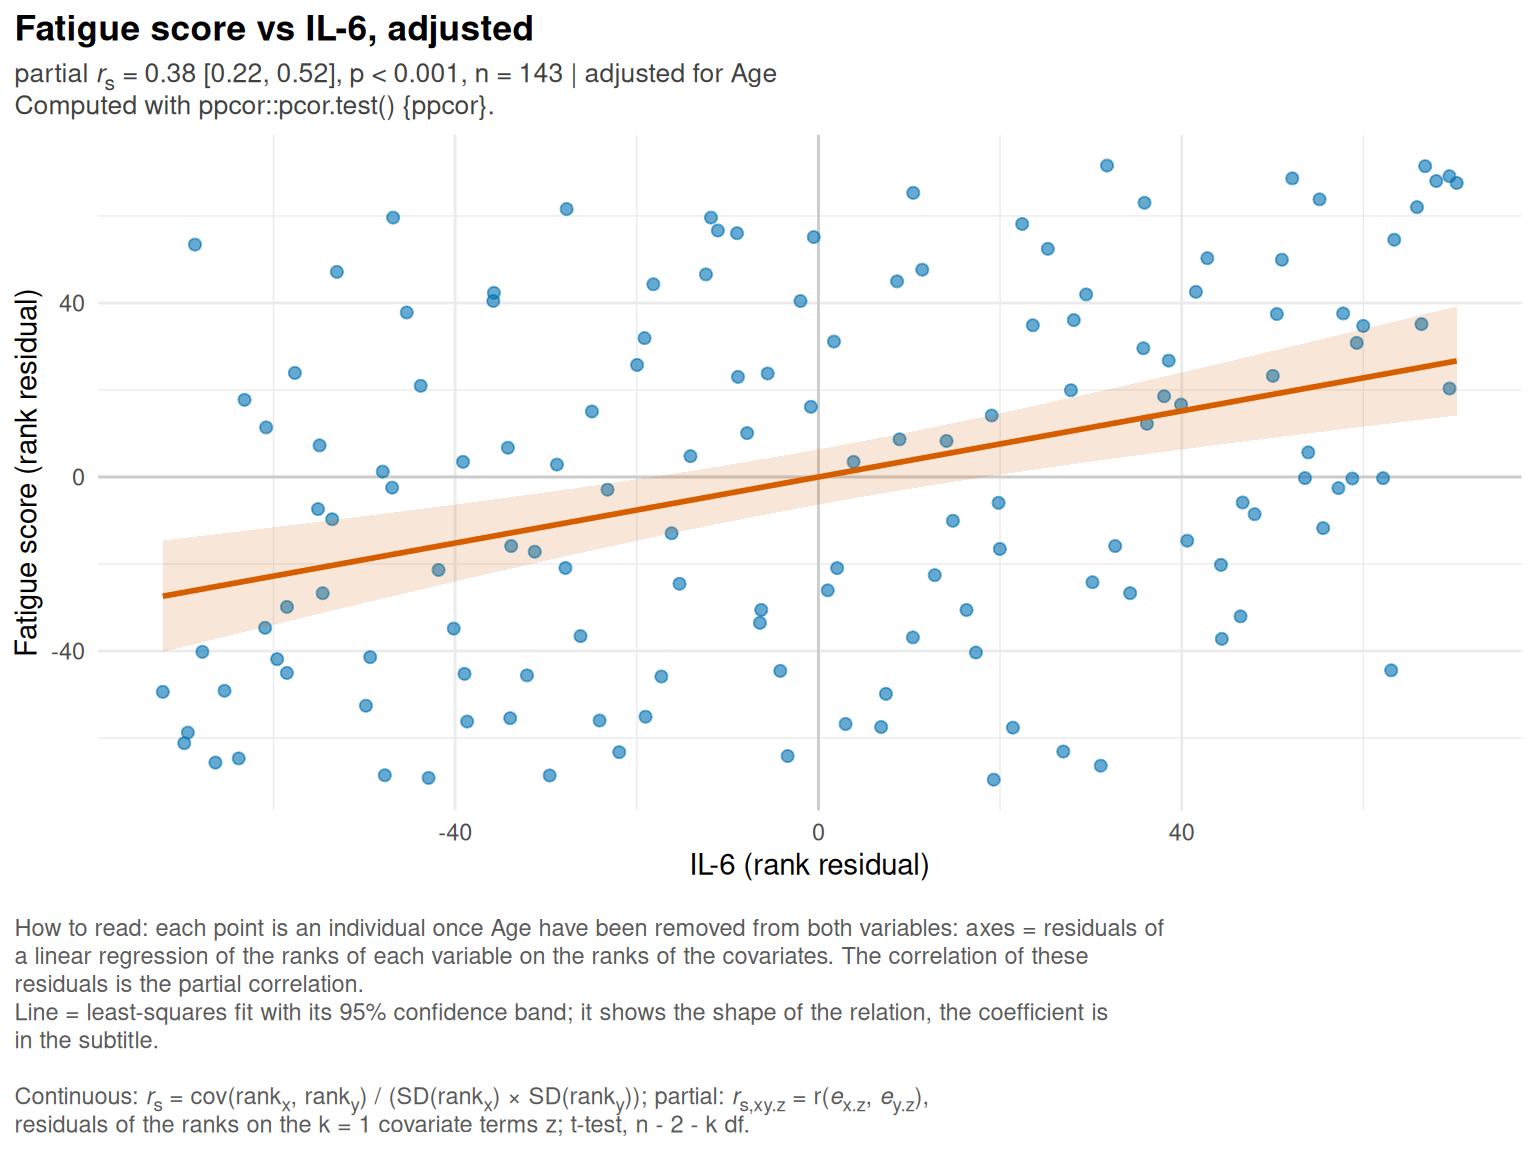
plot() (and autoplot(), its ggplot2 equivalent) draw the output of cor_compute(); the kind of plot is chosen with type:
“heatmap” (default): plot_cor_heatmap(), triangle for a matrix, rectangle for a cross analysis;
“forest”: plot_cor_forest(), each coefficient with its confidence interval;
“scatter”: plot_cor_pair() for one pair (pair = c(“x”, “y”); by default the pair with the largest |coefficient|), with the covariates and the method of the analysis.
## S3 method for class 'cor_result'
plot(x, type = c("heatmap", "forest", "scatter"), pair = NULL, ...)

## S3 method for class 'cor_result'
autoplot(object, type = c("heatmap", "forest", "scatter"), pair = NULL, ...)
x, object
|
output of cor_compute()
|
type
|
“heatmap”, “forest” or “scatter”
|
pair
|
type = “scatter”: the two variables of the pair
|
…
|
passed to the plotting function (labels, title, base_size, palette for the heatmap and the forest plot; smooth, point_colour… for the scatter plot)
|
a ggplot