
Heatmap of a correlation analysis

Description

  • matrix analysis (cor_compute(y = NULL)): lower triangle, diagonal included;

  • cross analysis: one row per x, one column per y.

Usage

plot_cor_heatmap(
  x,
  labels = NULL,
  use_adj = TRUE,
  order = c("hclust", "original"),
  show_values = TRUE,
  base_size = 10,
  title = NULL,
  value_size = NULL,
  show_note = TRUE,
  split_binary = TRUE,
  palette = COR_PAL,
  caption_width = 110,
  separator = c("facet", "line")
)

Arguments

x output of cor_compute()
labels named vector variable -> display label (default: the labels given to cor_compute())
use_adj stars on adjusted (TRUE) or raw p-values
order matrix only: “hclust” (within each block if split_binary) or “original”
show_values print the coefficient and the stars in each cell
base_size base font size
title title (default "Correlation matrix" or " correlations")
value_size size of the values
show_note add the binary-variable line to the caption
split_binary binary variables in a separate block
palette colours of the negative / positive correlations (named low / high)
caption_width wrap the caption lines at this number of characters (NULL = no wrapping)
separator matrix only: “facet” (panels with strips, default) or “line” (separator lines, square tiles)

Details

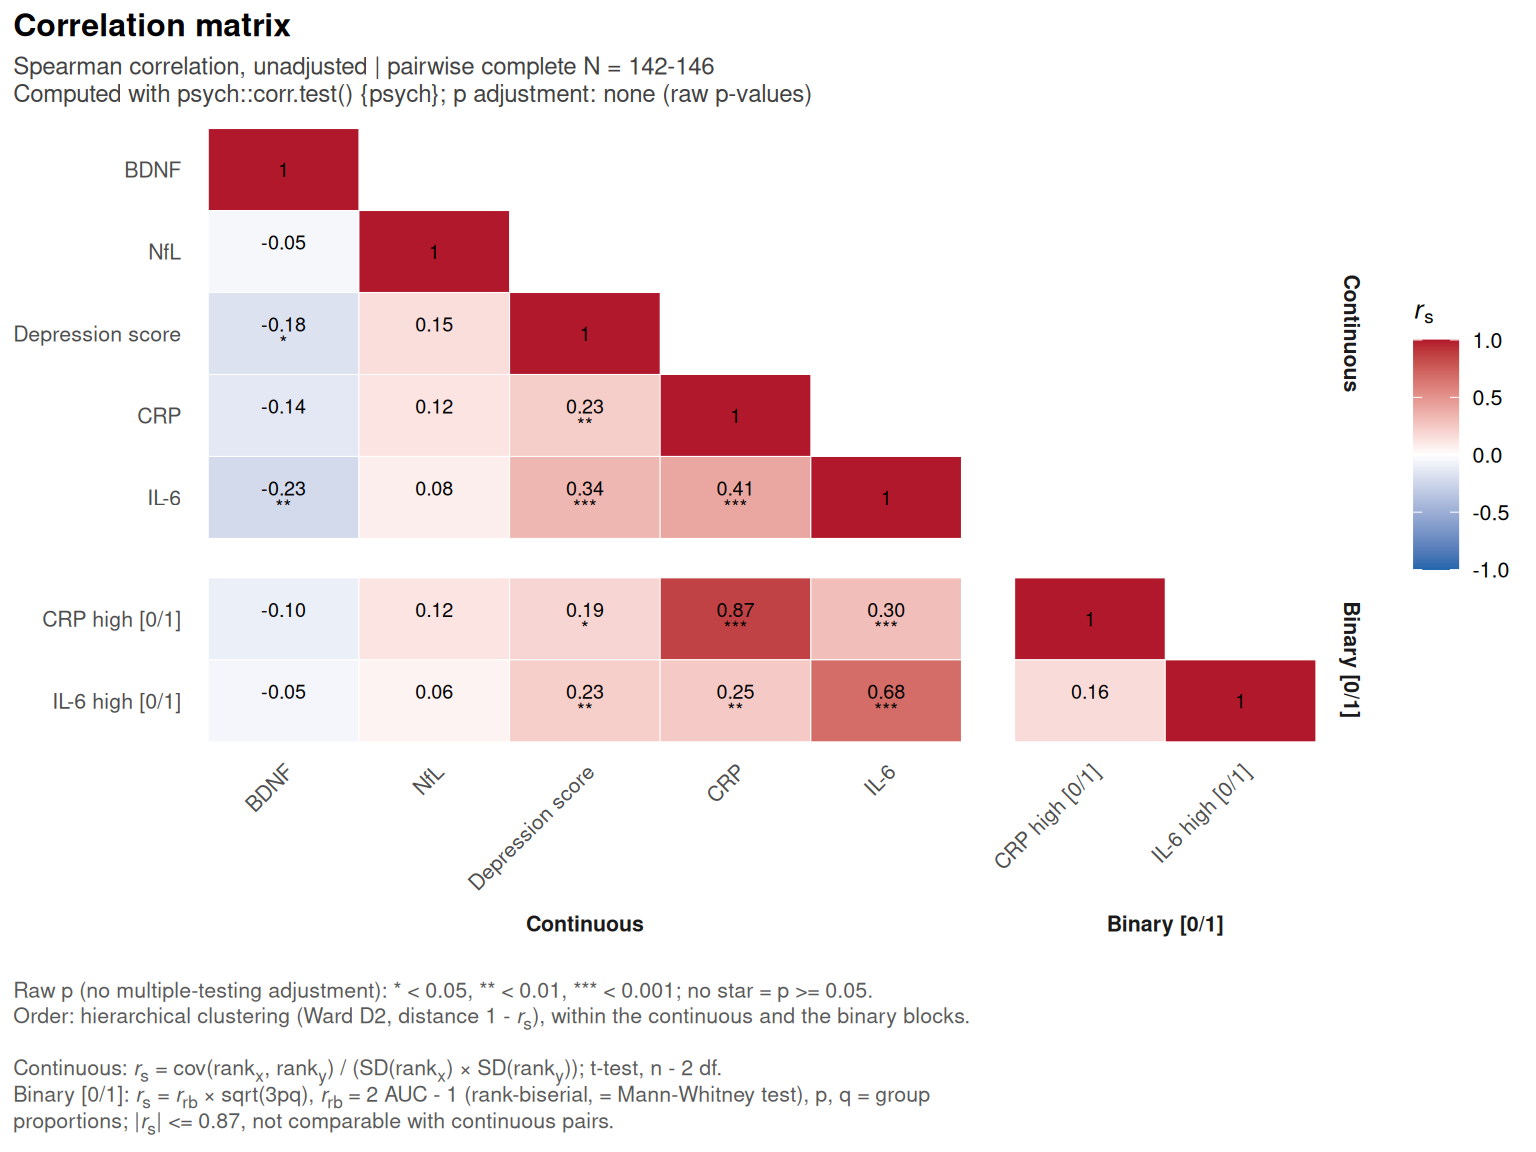
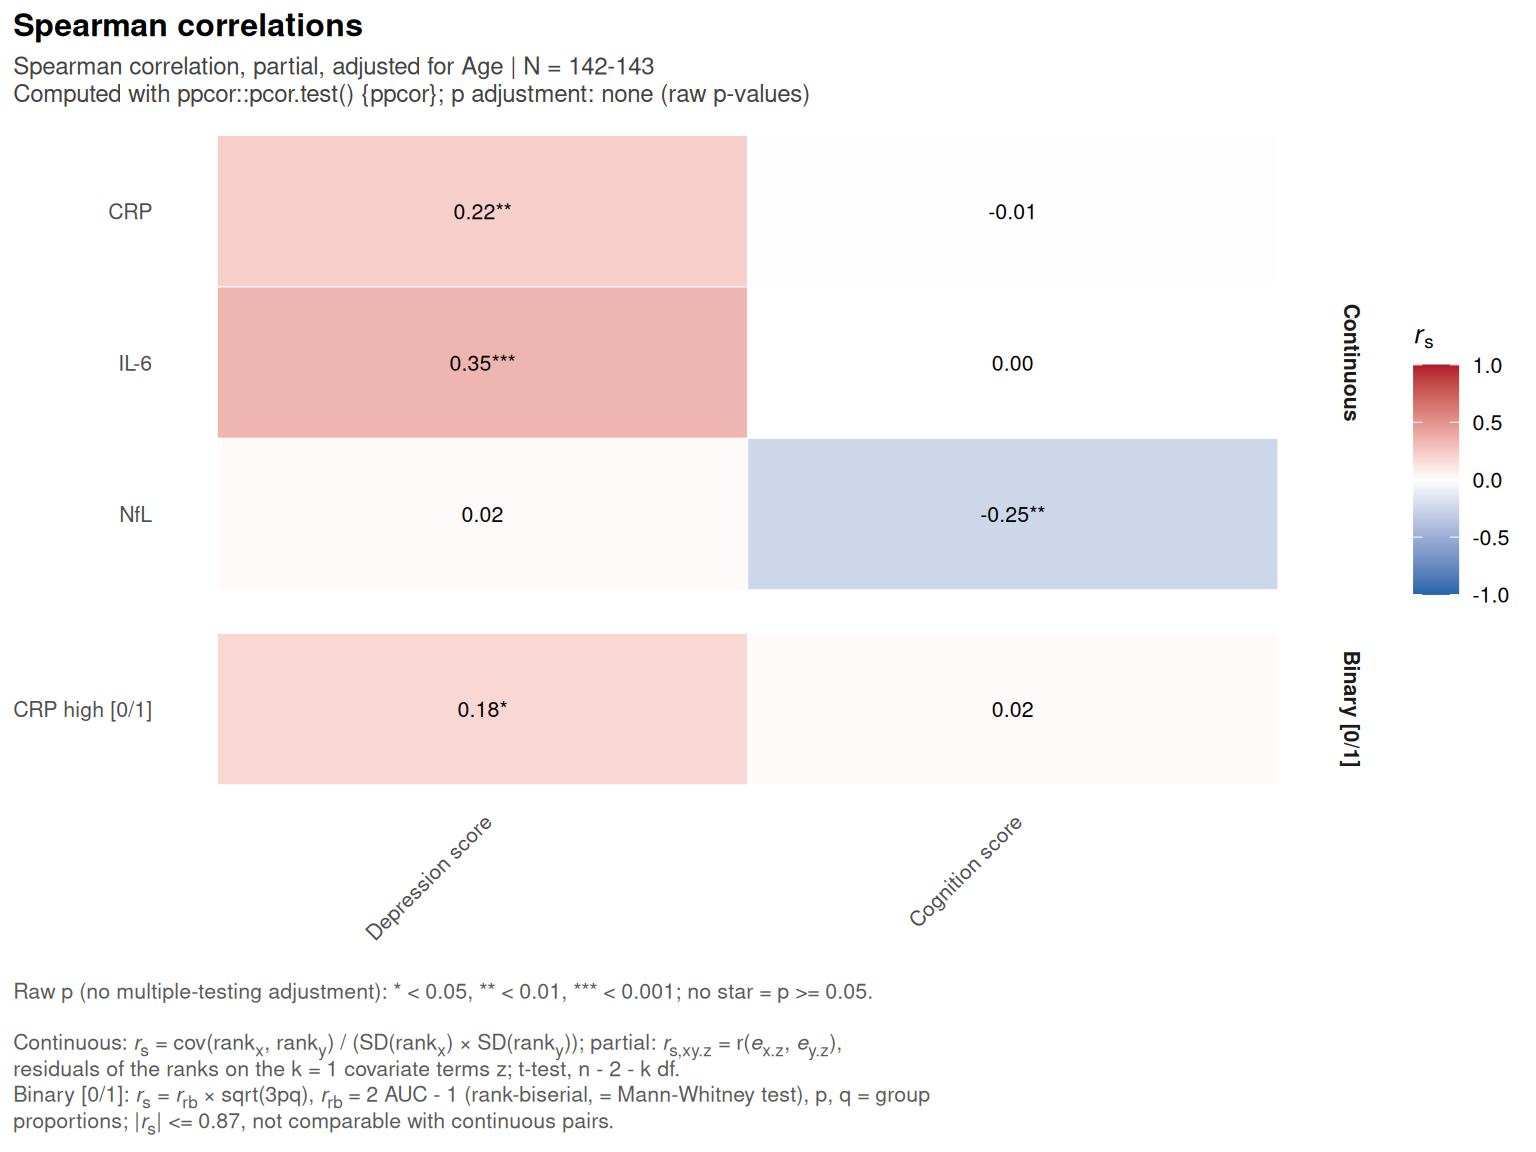
Each cell shows the coefficient and the stars of its p-value (adjusted if an adjustment was requested); the subtitle gives the method, the adjustment for covariates, N and the engine; the caption gives the status of the p-values, the formula of the coefficient and the reading of binary cells.

Value

a ggplot

See Also

plot() on a cor_compute() result, which calls this function for type = “heatmap”.

Examples

library("corrkit")

d  <- simulate_cor_data(150)
cm <- cor_compute(d, c("CRP", "IL6", "BDNF", "NfL", "depression", "BIN_CRP", "BIN_IL6"),
                  labels = attr(d, "labels"))
plot_cor_heatmap(cm)
cc <- cor_compute(d, x = c("CRP", "IL6", "NfL", "BIN_CRP"), y = c("depression", "cognition"),
                  covariates = "age", labels = attr(d, "labels"))
plot_cor_heatmap(cc)
Back to top