
Plot of one correlation, with its coefficient, CI and test in the subtitle

Description

What is drawn is what the coefficient measures:

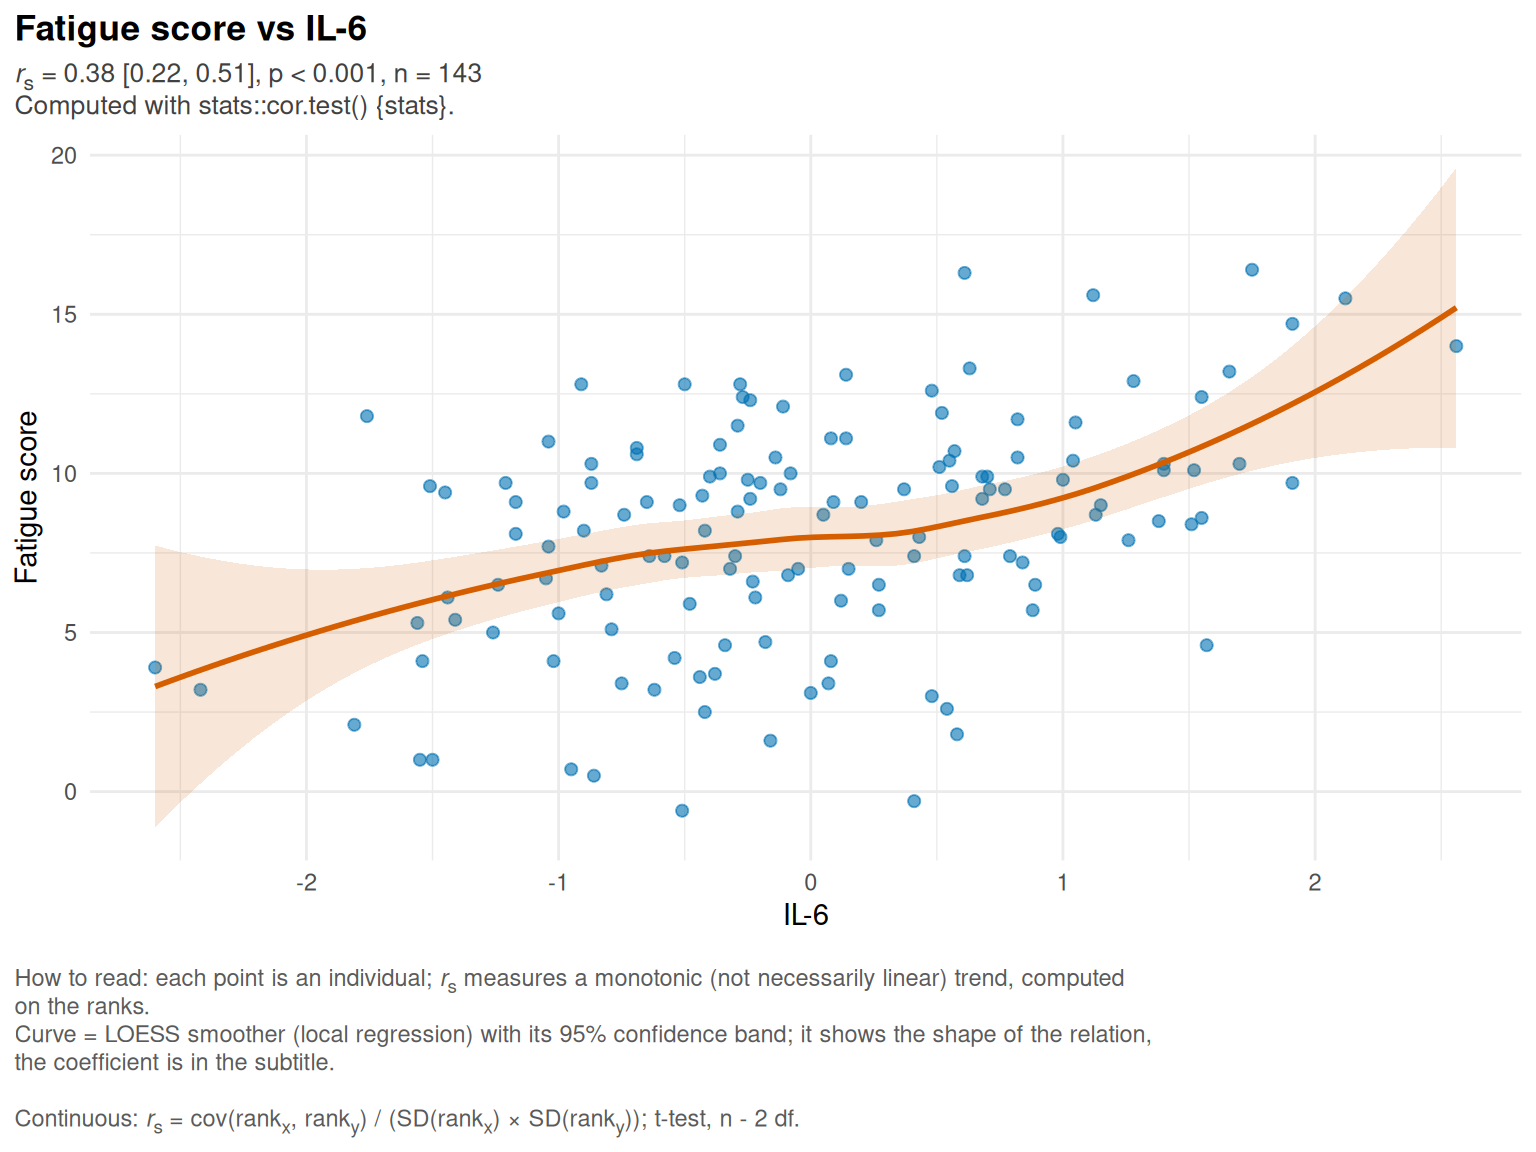
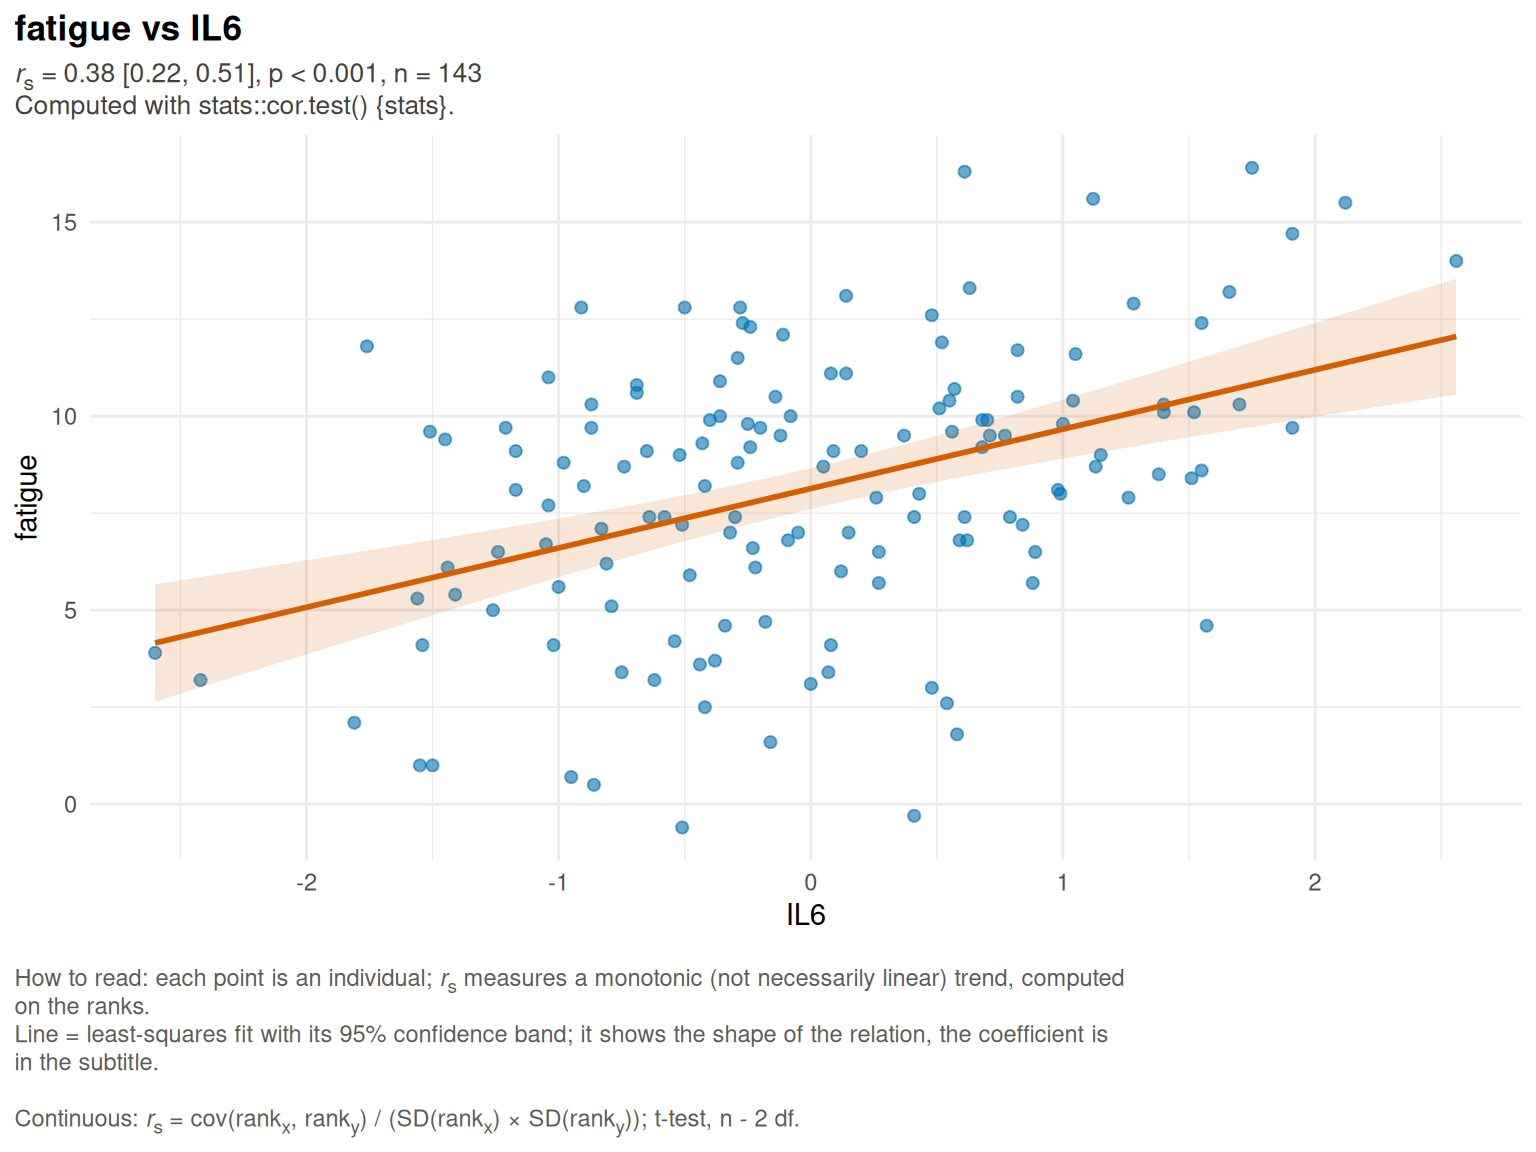
  • two continuous variables, unadjusted: scatter plot of the raw values with a fitted curve; by default a least-squares line for Pearson (r measures a straight line) and a LOESS curve for Spearman and Kendall (monotonic trend);

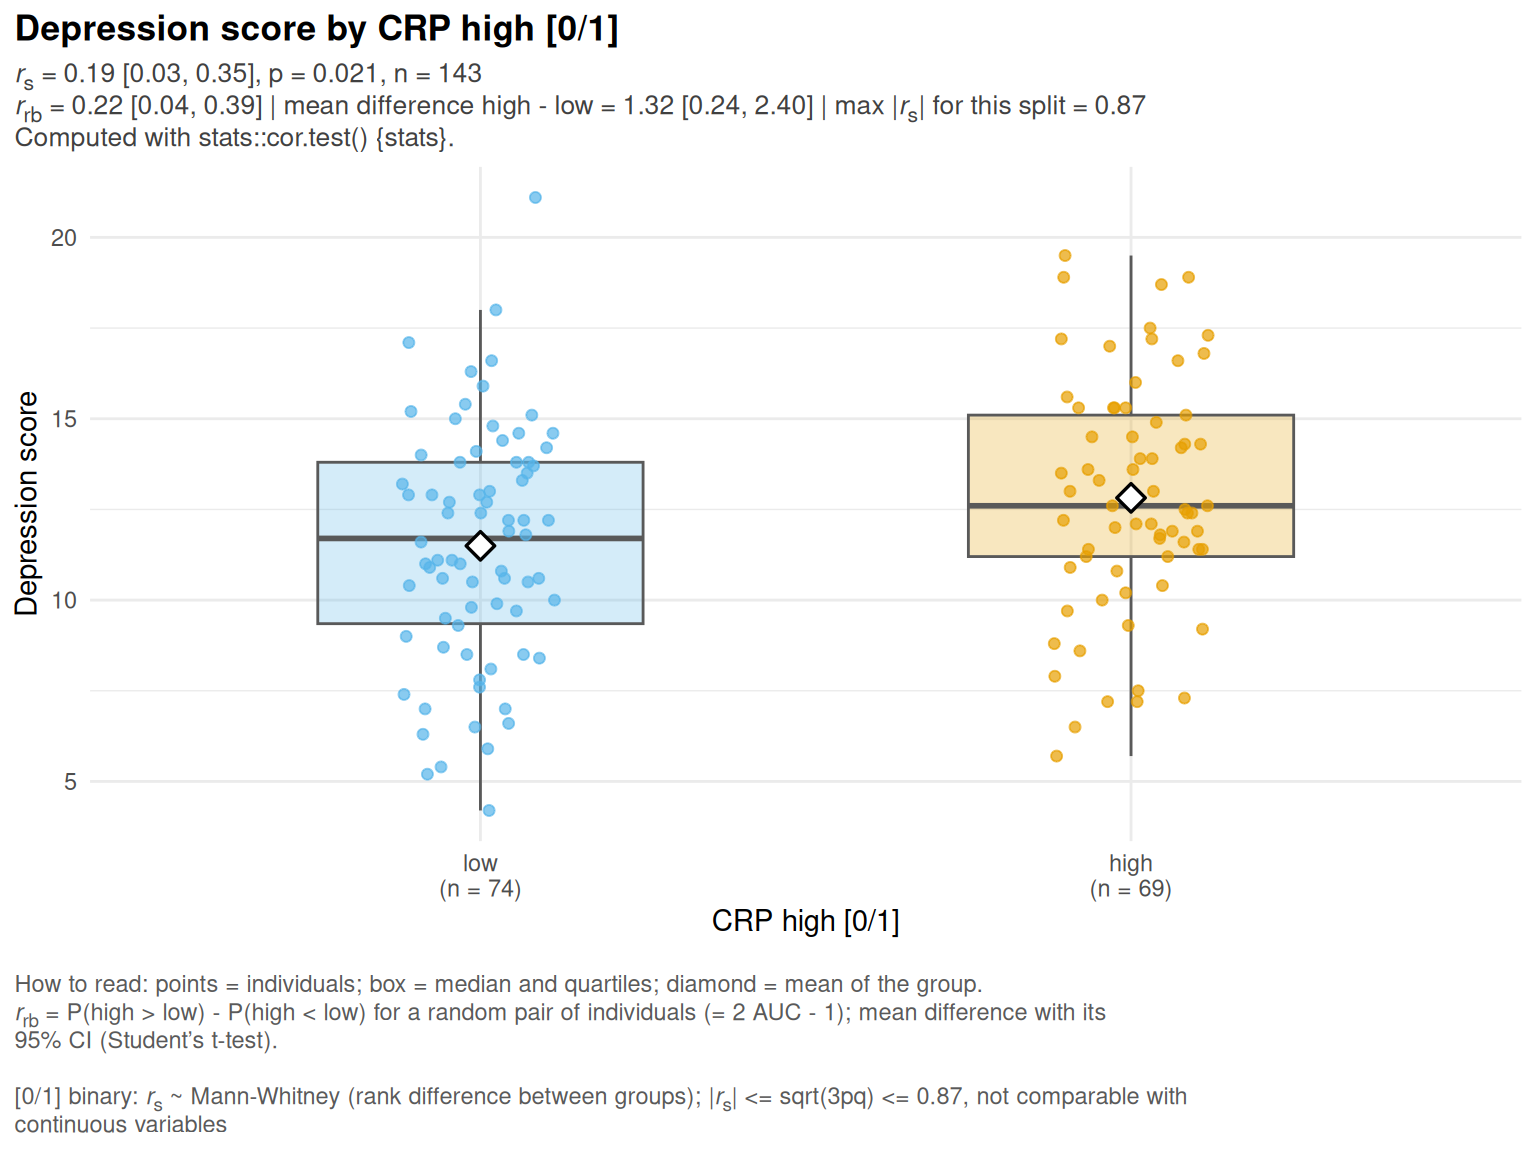
  • one binary variable, unadjusted: the continuous variable by group (box, points, diamond = mean), with r_rb and the difference in means (cor_binary_effects());

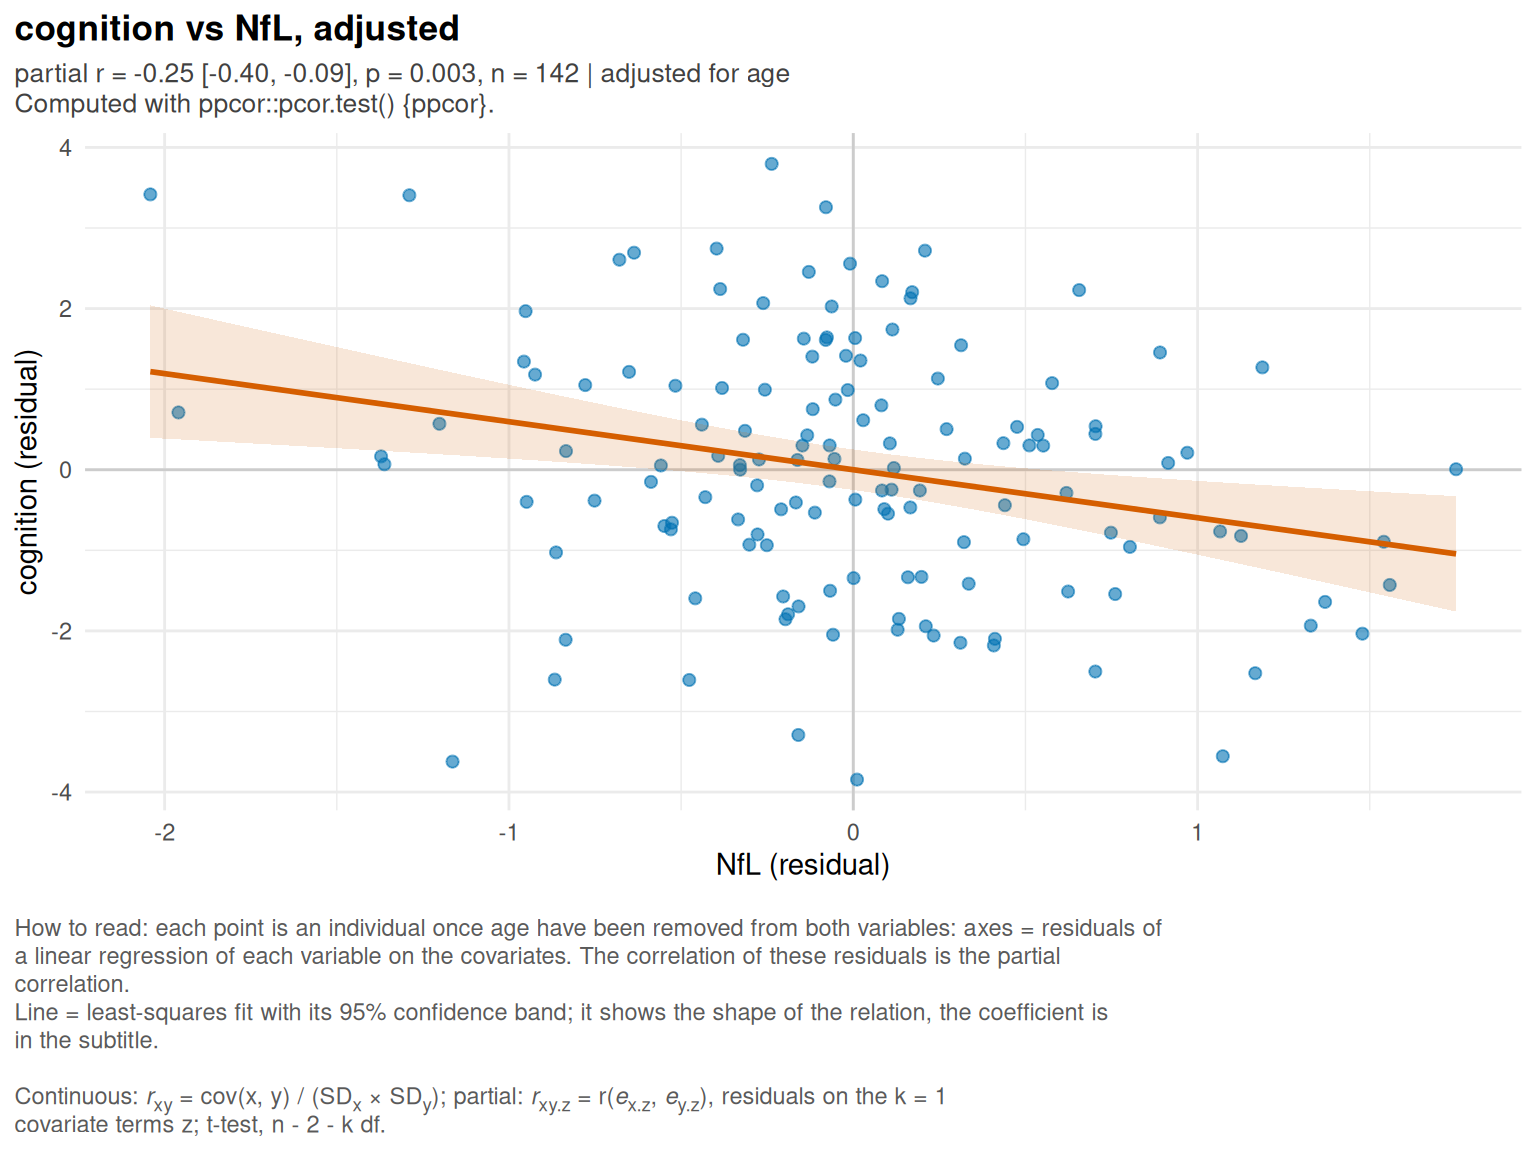
  • with covariates: added-variable plot, i.e. residuals of y against residuals of x on the covariates (ranks for Spearman), whose correlation IS the partial correlation; by default a least-squares line.

Usage

plot_cor_pair(
  data,
  x,
  y,
  covariates = NULL,
  labels = NULL,
  meth = c("spearman", "pearson", "kendall"),
  engine = c("ppcor", "base"),
  ci = 0.95,
  smooth = NULL,
  smooth_args = list(),
  se = TRUE,
  point_colour = "#0072B2",
  line_colour = "#D55E00",
  group_colours = c("#56B4E9", "#E69F00"),
  bin_mark = " [0/1]",
  base_size = 11,
  title = NULL
)

Arguments

data data frame
x, y names of the two variables
covariates covariates of the partial correlation (NULL = unadjusted)
labels named vector variable -> display label
meth “spearman” (ranks), “pearson” (values) or “kendall”
engine “ppcor” (default) or “base” (residual method)
ci confidence level of the interval (NULL = none); Fisher z on n - k
smooth fitted curve, passed to ggplot2::geom_smooth(method = ): “lm”, “loess”, “gam”, “glm”, a function, or “none” for no curve. NULL (default) = “lm” for Pearson and partial correlations, “loess” for Spearman and Kendall.
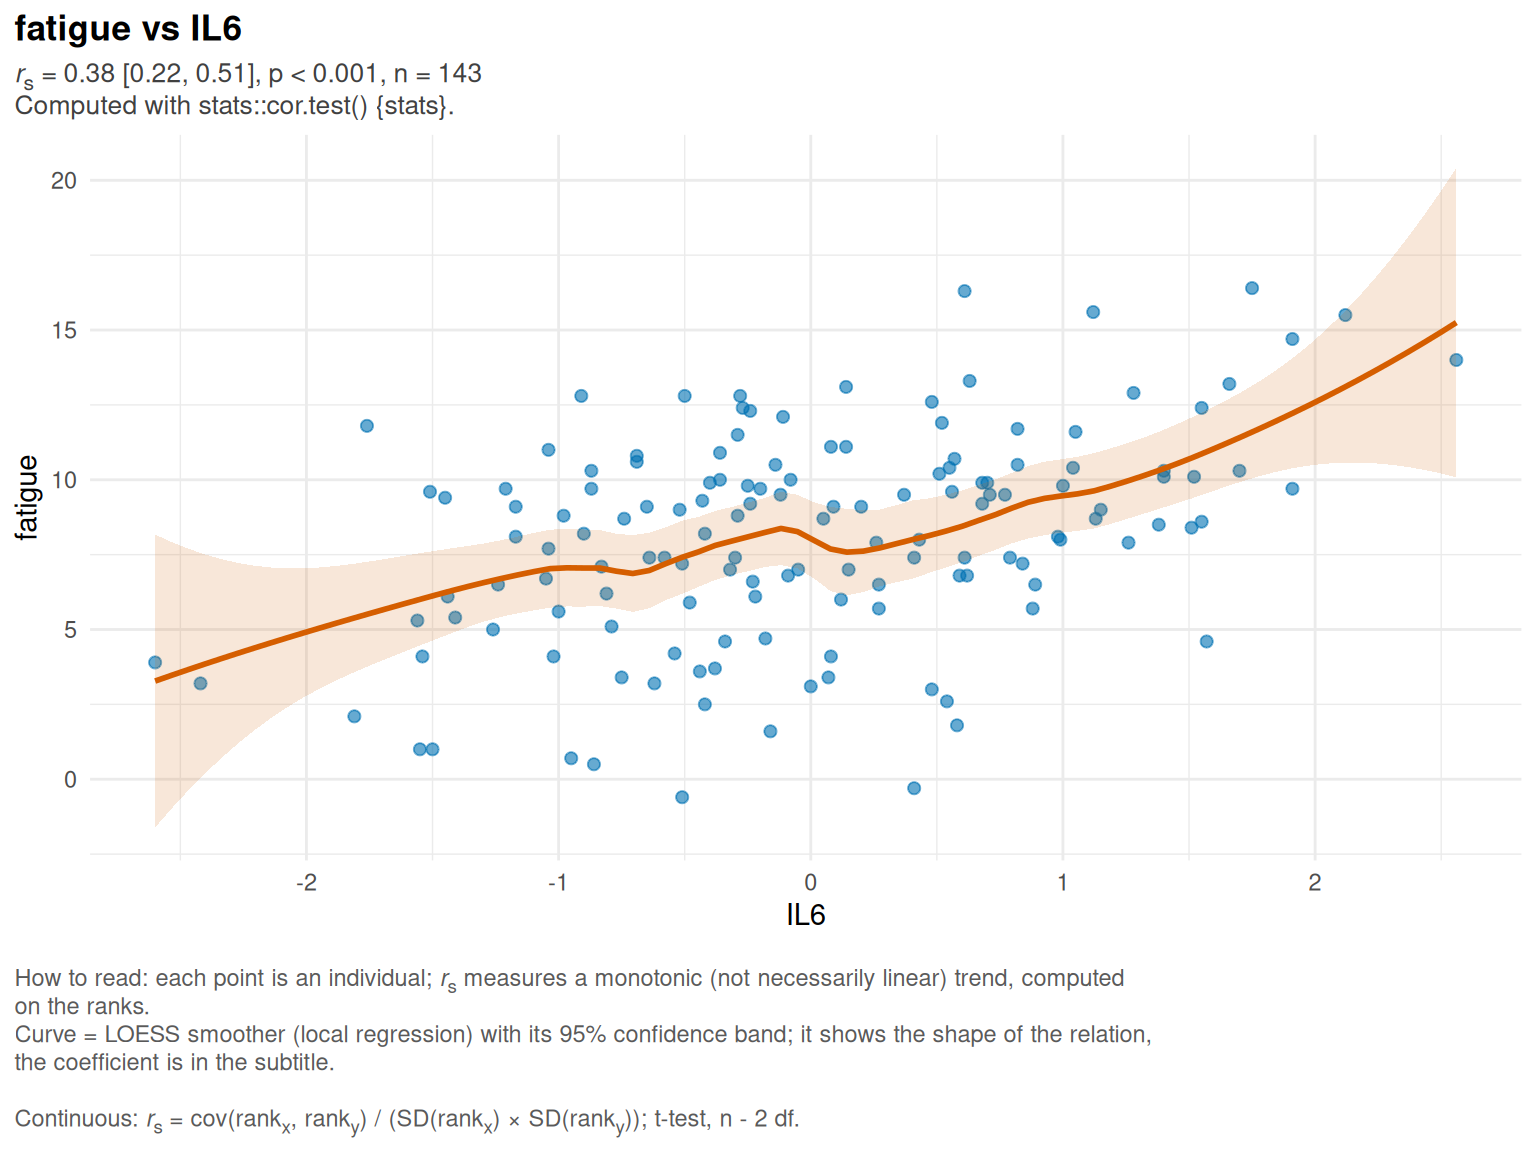
smooth_args list of other arguments of ggplot2::geom_smooth(), e.g. list(span = 0.5) for LOESS or list(formula = y ~ poly(x, 2))
se draw the confidence band of the curve
point_colour colour of the points (scatter plots)
line_colour colour of the curve and its band
group_colours colours of the two groups (binary variable), lower level first
bin_mark marker appended to the label of a binary variable
base_size base font size
title title (default " vs ")

Details

Default colours come from the Okabe-Ito palette, readable with the common colour-vision deficiencies.

Value

a ggplot

Examples

library("corrkit")

d <- simulate_cor_data(150)
plot_cor_pair(d, "IL6", "fatigue", labels = attr(d, "labels"))
plot_cor_pair(d, "IL6", "fatigue", smooth = "lm")
plot_cor_pair(d, "IL6", "fatigue", smooth = "loess", smooth_args = list(span = 0.5))
plot_cor_pair(d, "BIN_CRP", "depression", labels = attr(d, "labels"))
plot_cor_pair(d, "NfL", "cognition", covariates = "age", meth = "pearson")
Back to top