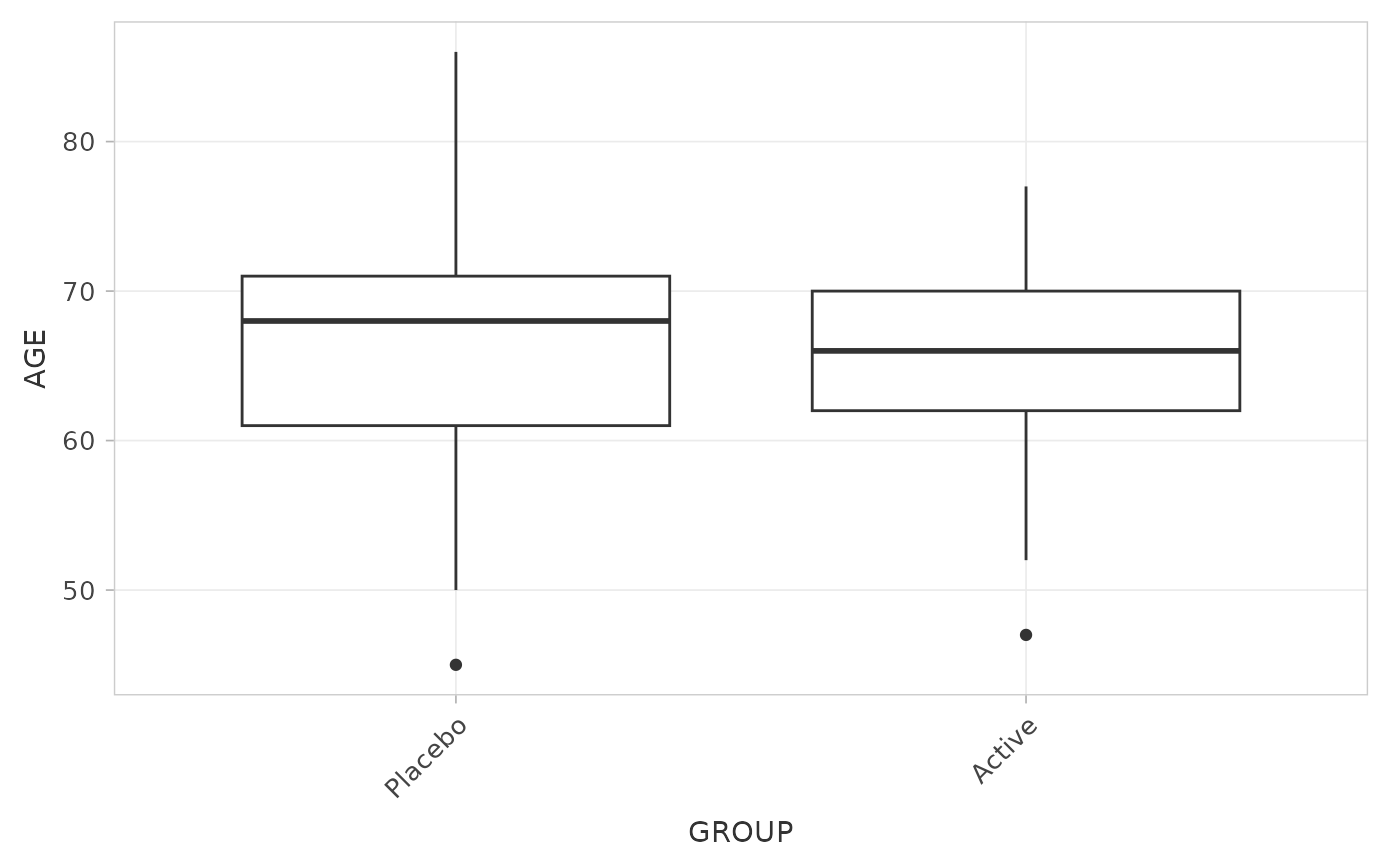
hjust = 1 and vjust = 1 anchor the end of the text on the tick; the
default vjust = 0.5 pushes long labels below the plot, where they get cut.
Value
A ggplot2::theme() object to add to a plot.
hjust = 1 and vjust = 1 anchor the end of the text on the tick; the
default vjust = 0.5 pushes long labels below the plot, where they get cut.
A ggplot2::theme() object to add to a plot.