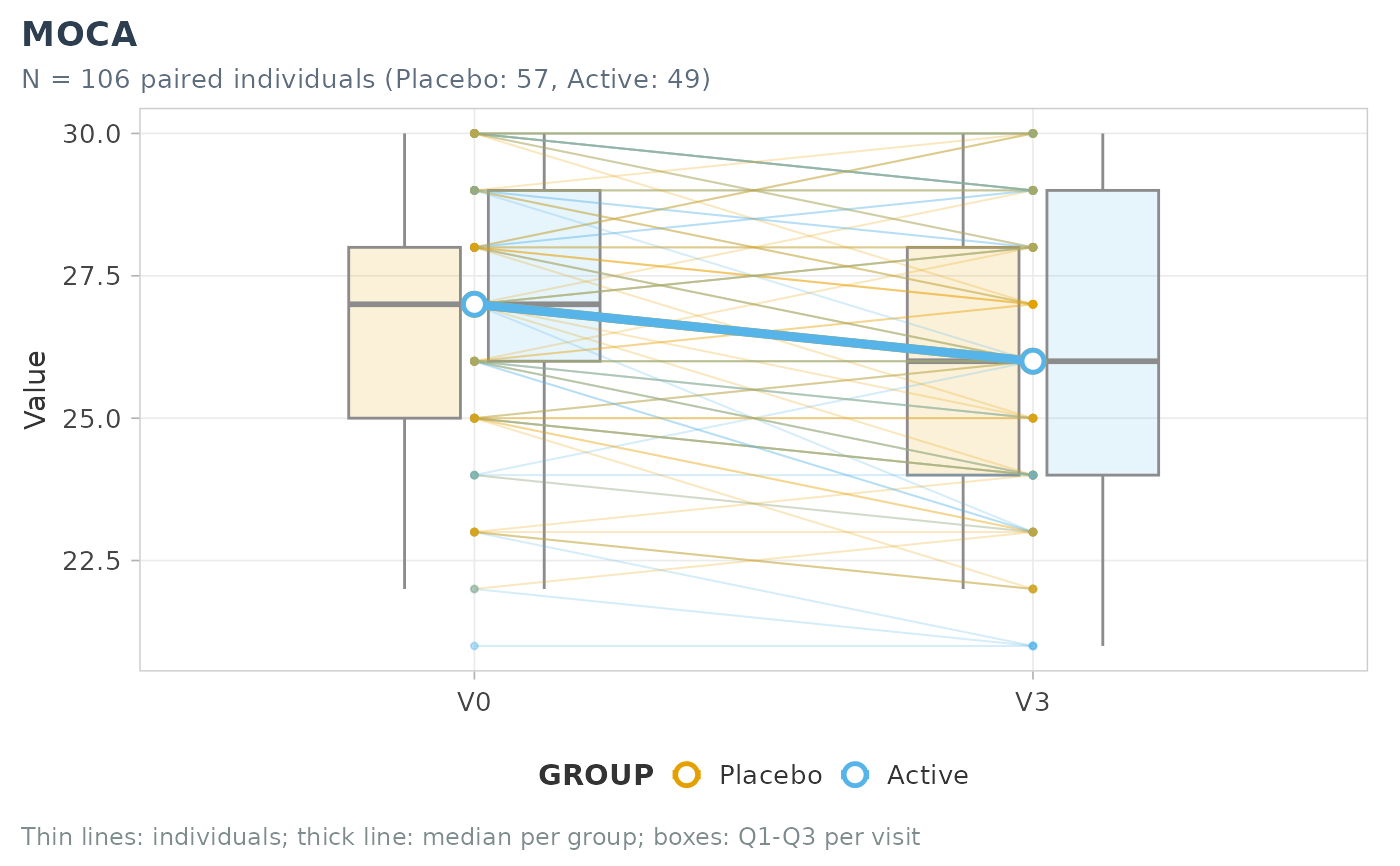
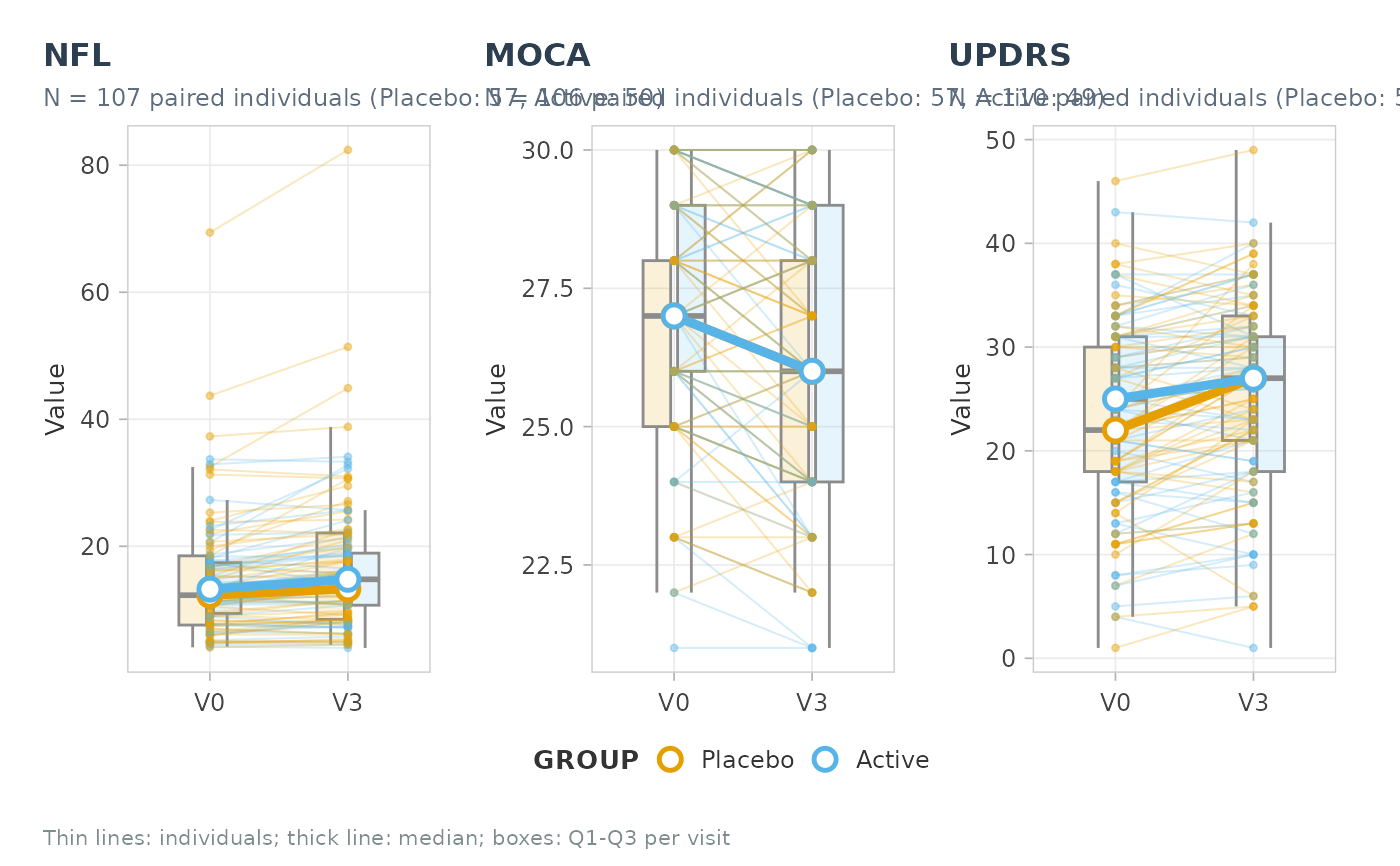
plot_trajectories() draws one thin line per subject, a thick summary
line (median or mean) per group and, optionally, boxplots per visit.
plot_trajectory_grid() draws one panel per root.
Usage
plot_trajectories(
  data,
  vars,
  id_col,
  group = NULL,
  labels = NULL,
  time_labels = NULL,
  title = NULL,
  y_lab = NULL,
  palette = NULL,
  show_box = TRUE,
  summary_fun = c("median", "mean"),
  line_alpha = 0.25,
  base_size = 11,
  ref_line = NULL
)

plot_trajectory_grid(
  data,
  roots,
  id_col,
  visits = c("V0", "V3"),
  group = NULL,
  labels = NULL,
  ncol = 3,
  base_size = 10,
  ...
)
Arguments
- data
Wide format (one column per visit).
- vars
Columns in chronological order, e.g.
c(NFL_V0, NFL_V3)(names or tidyselect).- id_col
Subject identifier.
- group
Optional colour variable.
- labels
Optional named vector of labels.
- time_labels
Visit labels (default: the suffixes of
vars).- title, y_lab
Title (default: label of the root) and y-axis title.
- palette
Colours of the groups.
- show_box
Boxplots per visit (and group) in the background.
- summary_fun
"median"or"mean".- line_alpha
Transparency of the subject lines.
- base_size
Base font size.
- ref_line
Optional horizontal reference line.
- roots
Root names (one panel each).
- visits
Visit suffixes.
- ncol
Number of columns of panels.
- ...
Passed to
plot_trajectories().