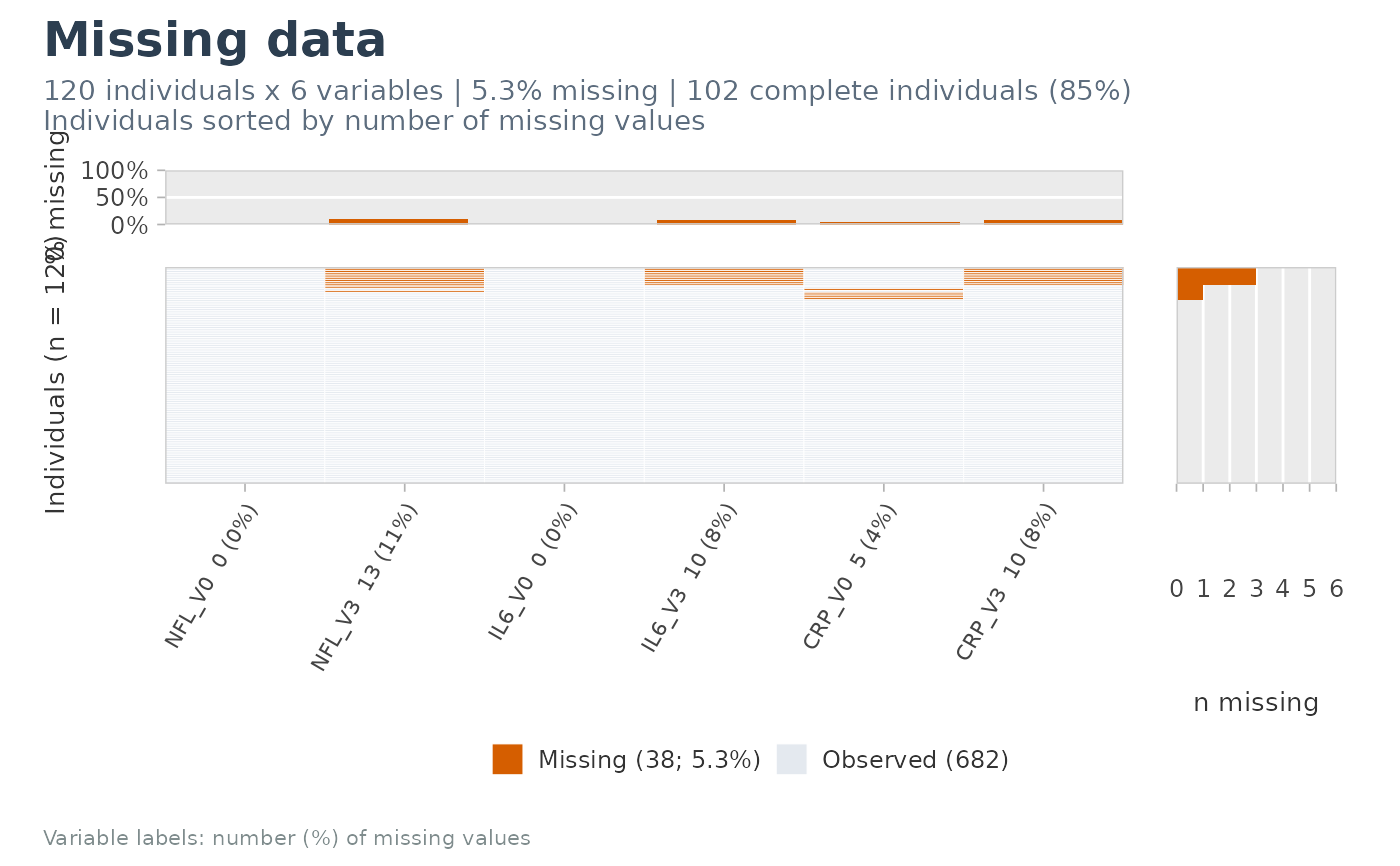
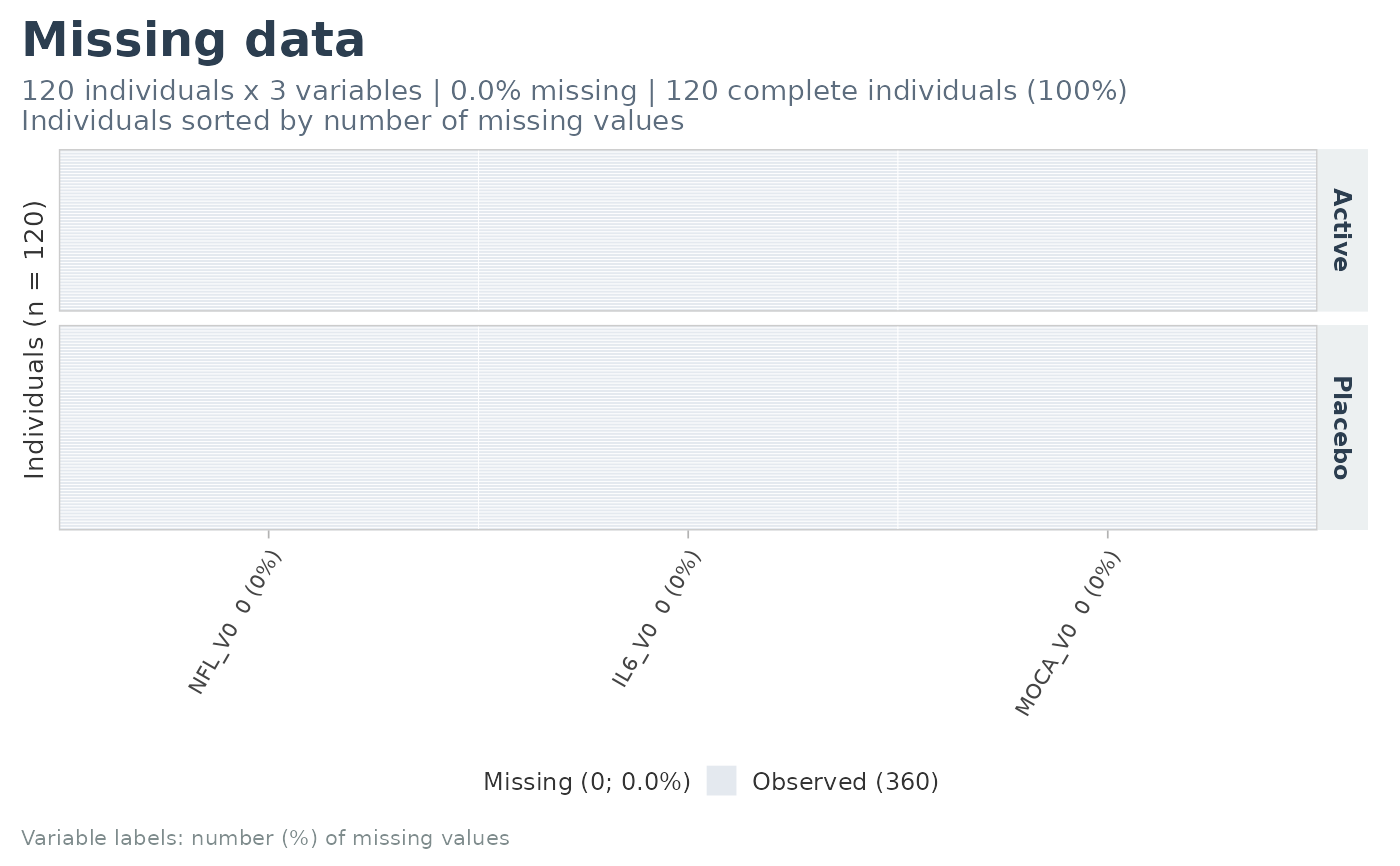
One tile per subject and variable. Subjects are sorted by number of missing
values; variable labels carry the count and share of missing values;
optional marginal bars give the share missing per variable (fixed 0-100%
scale) and the number missing per subject. Strings such as "NA" or ""
count as missing.
Usage
plot_na_map(
  data,
  vars = NULL,
  id_col = NULL,
  labels = NULL,
  group = NULL,
  orientation = c("cols", "rows"),
  sort_rows = TRUE,
  sort_vars = FALSE,
  na_strings = c("NA", "", "NaN", "N/A"),
  title = "Missing data",
  subtitle = NULL,
  palette = "okabe",
  margins = TRUE,
  show_ids = "auto",
  tile_border = "auto",
  show_pct = TRUE,
  x_angle = 60,
  x_text_size = NULL,
  base_size = 10,
  bar_bg = "grey92",
  title_size = 1.8
)
Arguments
- data
A data frame.
- vars
Variables to show (names or tidyselect; default: all but
id_colandgroup).- id_col
Identifier column (default: row numbers).
- labels
Optional named vector of labels.
- group
Optional grouping column: one panel per group.
- orientation
"cols": variables in columns;"rows": variables in rows.- sort_rows
Sort subjects by number of missing values.
- sort_vars
Sort variables by share of missing values.
- na_strings
Strings counted as missing in character / factor columns.
- title, subtitle
Titles (
subtitle = NULL: automatic summary).- palette
"okabe","viridis","cividis"orc(Missing = , Observed = ).- margins
Add the marginal bar charts.
- show_ids
Show subject identifiers (
"auto": when n <= 60).- tile_border
Colour of the tile borders (
"auto": white when n <= 150).- show_pct
Add the count (%) of missing values to the variable labels.
- x_angle
Angle of the x-axis labels.
- x_text_size
Size of the axis labels (
NULL:base_size - 2).- base_size
Base font size.
- bar_bg
Background colour of the marginal bar charts.
- title_size
Title size relative to
base_size.