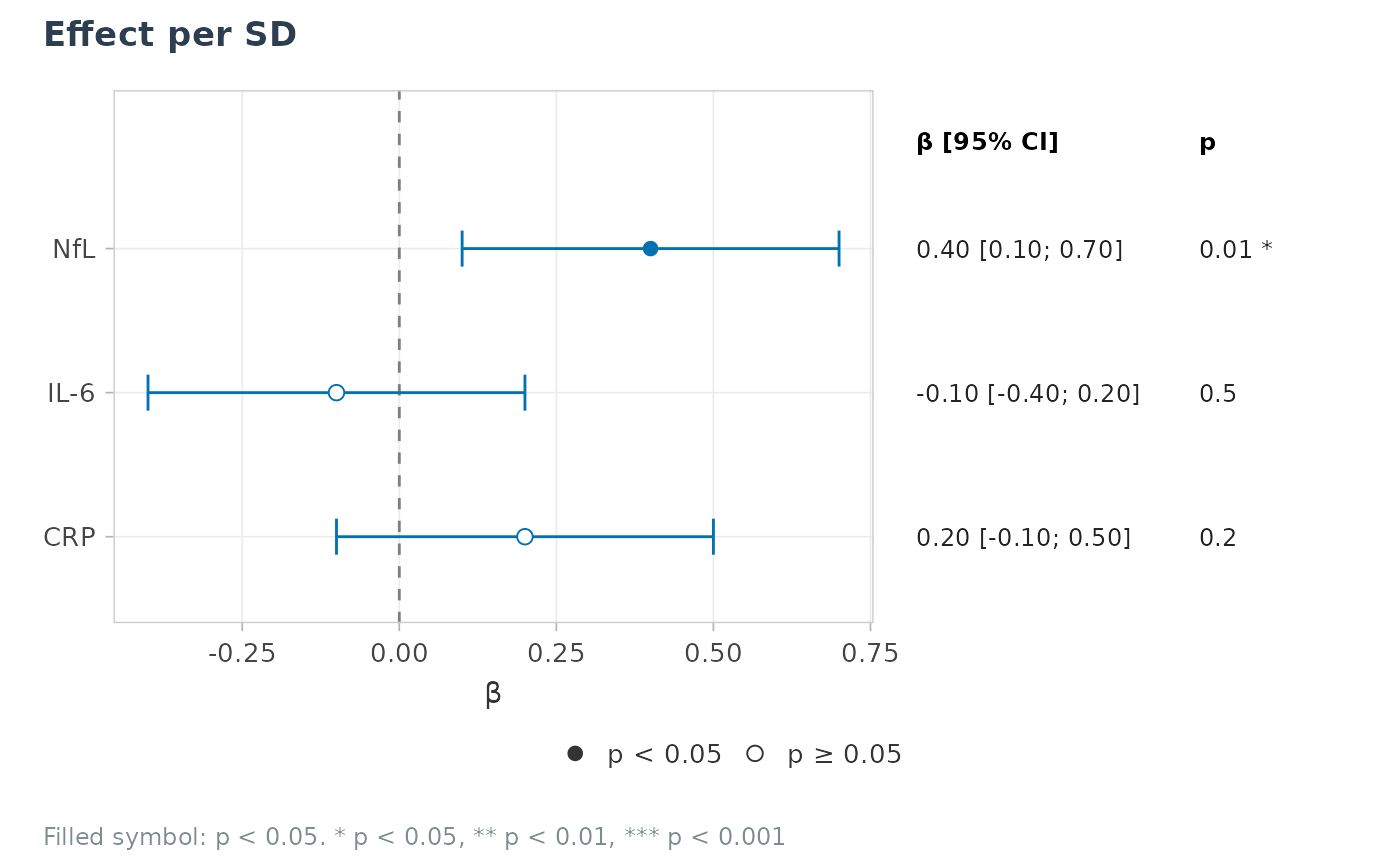
One row per term: point estimate and confidence interval on the left, a
text column "estimate [95% CI]" and a column "p" with stars on the right
(aligned on the same rows), and optionally a column of adjusted p-values.
Several estimates per term (group, e.g. two models) are offset inside the
row rather than dodged along x, which would change the estimate.
Usage
plot_forest(
  df,
  label = "label",
  estimate = "estimate",
  low = "conf.low",
  high = "conf.high",
  p = "p.value",
  p_adj = NULL,
  group = NULL,
  ref = 0,
  log_x = FALSE,
  effect_label = "β",
  xlab = NULL,
  title = NULL,
  subtitle = NULL,
  caption = NULL,
  palette = NULL,
  digits = 2,
  base_size = 11,
  widths = c(3, 1.7)
)
Arguments
- df
Data frame, one row per term (and per
group).- label, estimate, low, high, p
Columns of the term label, estimate, CI bounds and p-value (names or bare symbols).
- p_adj
Optional column of adjusted p-values (third text column).
- group
Optional column distinguishing several estimates per term.
- ref
Reference line (0 for differences, 1 for ratios).
- log_x
Logarithmic x axis (odds ratios).
- effect_label
Header of the estimate column, e.g.
"OR".- xlab
X-axis title (default:
effect_label).- title, subtitle, caption
Titles; the caption also explains the symbols.
- palette
Colours of the groups.
- digits
Decimals of the estimates.
- base_size
Base font size.
- widths
Relative widths of the plot and text panels.