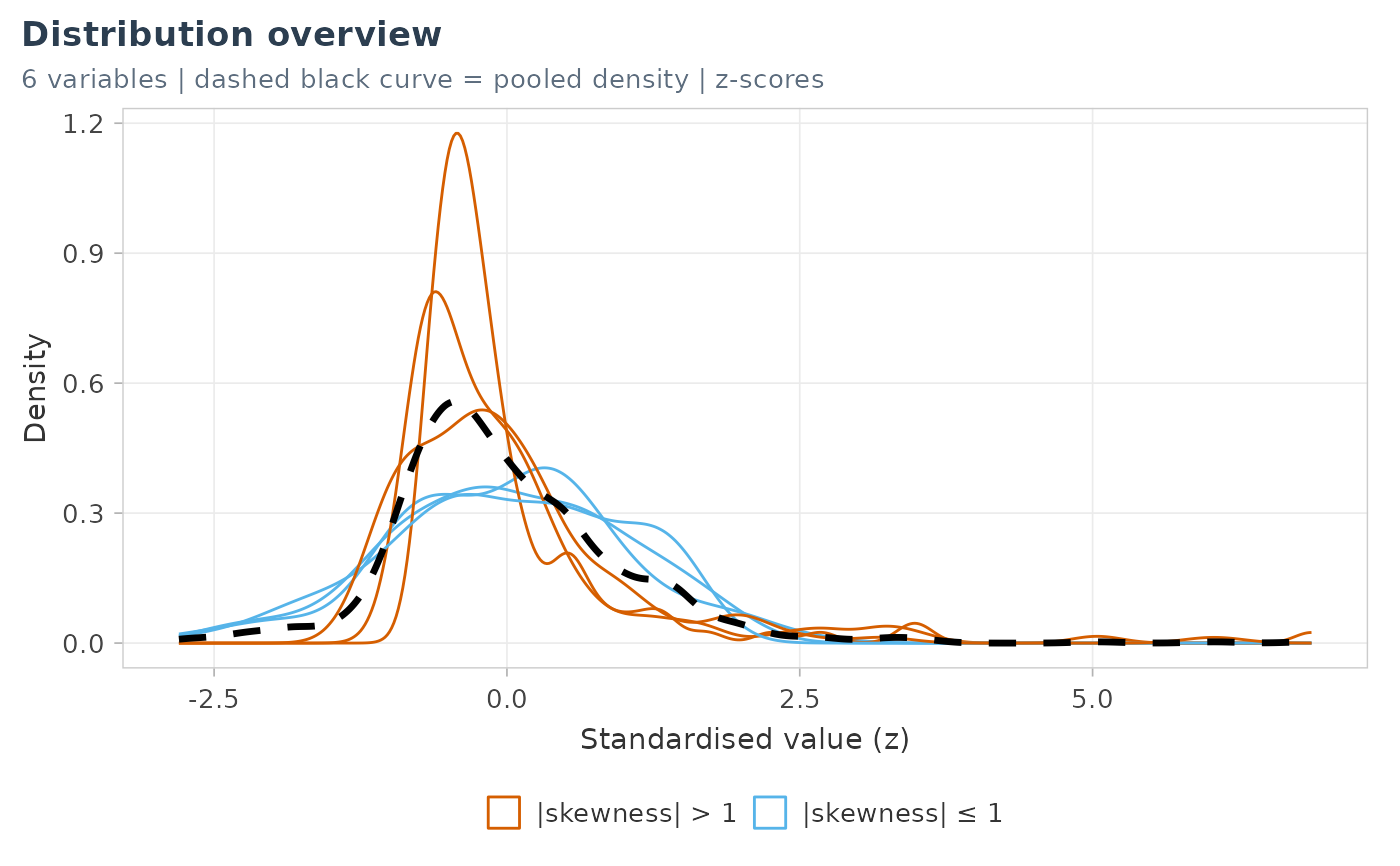
Overlaid standardised densities of a block of variables
Source:R/plot-distribution.R
plot_distribution_overview.RdOne density per variable (z-scores by default), coloured by the absolute skewness, with the pooled density as a dashed black curve: a quick look at the shapes of many variables.
Usage
plot_distribution_overview(
  data,
  vars,
  labels = NULL,
  group = NULL,
  scale = TRUE,
  base_size = 11,
  title = NULL,
  highlight_skew = 1
)
Arguments
- data
A data frame.
- vars
Numeric variables (names or tidyselect).
- labels
Optional named vector of labels.
- group
Optional grouping column: one panel per group.
- scale
Standardise each variable (z-scores).
- base_size
Base font size.
- title
Title.
- highlight_skew
Absolute skewness above which a density is highlighted.
Examples
plot_distribution_overview(cohort_sim, c(AGE, BMI, NFL_V0, IL6_V0, CRP_V0, MOCA_V0))