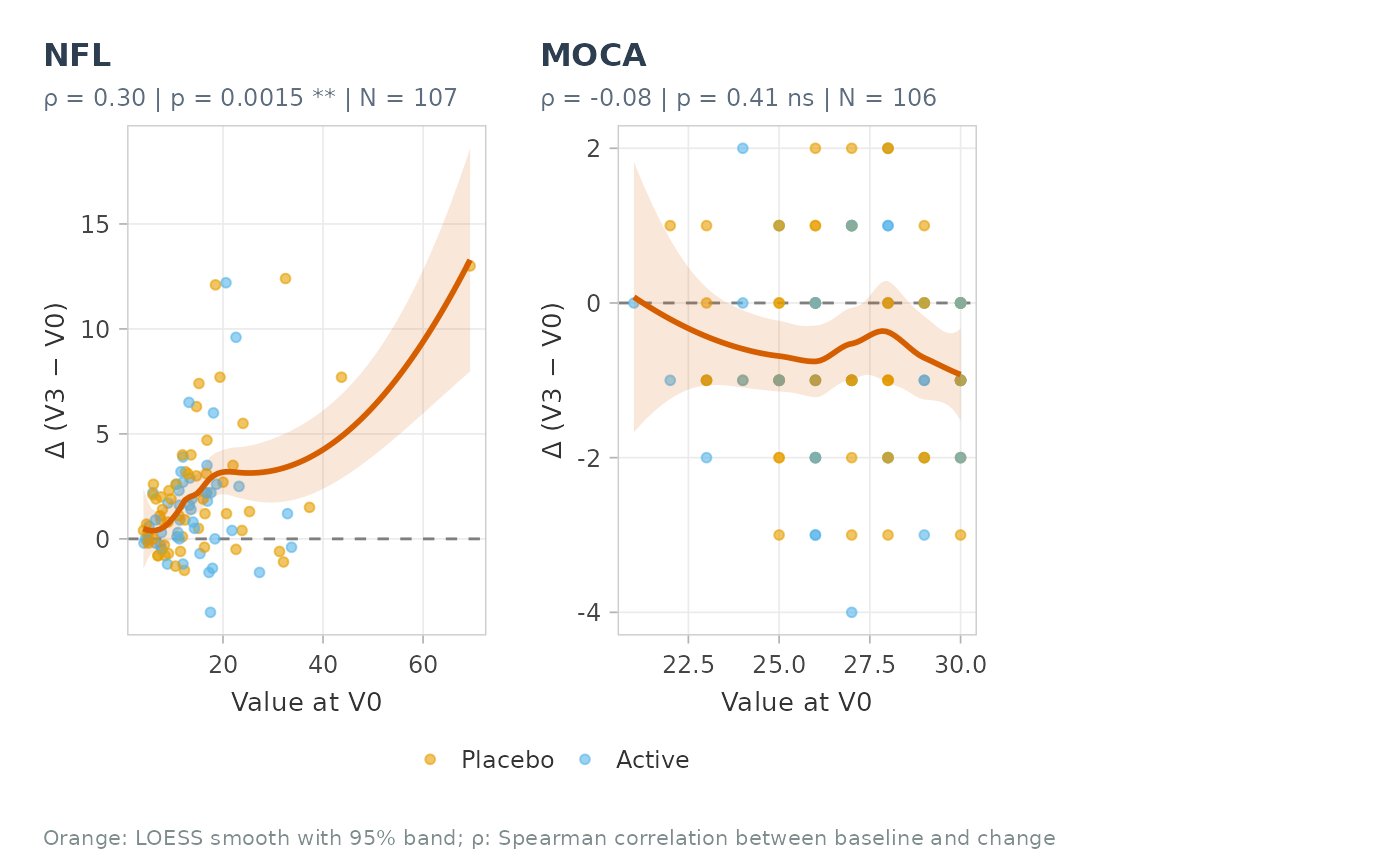
Shows regression to the mean and floor / ceiling effects: change between two visits against the first-visit value, LOESS smooth with its 95% band and the Spearman correlation between baseline and change.
Usage
plot_delta_vs_baseline(
  data,
  roots,
  from = "V0",
  to = "V3",
  labels = NULL,
  group = NULL,
  palette = NULL,
  ncol = 3,
  base_size = 10
)Examples
plot_delta_vs_baseline(cohort_sim, c("NFL", "MOCA"), group = GROUP)